Clean energy transition is facing geopolitical uncertainties, supply chain bottlenecks, high costs (high inflation). There is also an increasing local backlash against transmission infrastructure or renewable energy projects. ‘Not in my backyard’ (NIMBY) movement has been building a momentum with at least 228 green projects in 35 US states facing restrictions.
It becomes critical for distribution companies to proactively shape load and balance demand and supply of power through either time varying rates or behind the meter tech such is energy storage or solar. By using data to proactively shape load the distribution companies strategically set themselves for the future complex balancing of supply and demand of power.
Mission
Empower distribution companies to better understand their customer usage and patterns, determine cost exposure, review and improve customer rate alignments, and identify potential overall cost reduction opportunities. Know your customer!
Vision
To shape future load and supply of power through continuous data diagnostic, simulation, and implementation.
Energy providers must know their customers! It starts with understanding the peak hours contribution from each customer class. Further, each customer class is analyzed through their largest consumers and their contribution to the costs. The tool visualizes load profiles that clearly identify whether customer classes have correlation with system load profile.
ISO vs C1 Rate Class: January ‘24
In this example, C1 rate was highly corelated to ISO load, hence there could be significant potential savings by strategically deploying behind the meter tech i.e. at meter(s) level that represent high concentration usage during peak hours
TU Rate Class Peak Hour Contribution
Just under 900 meters contributed to more than 50% of load during the system level peak hour! The user can can simulate time varying rates impact or solar/storage feasibility starting at the meter level
Day Ahead vs Real Time vs PPA/Forwards
Distribution companies can compare PPA/forward prices against day ahead and real time market. The data is trained and used for machine learning budgets predicting e.g. for power cost adjustment
02
Simulation
Energy providers understand which incremental strategy change will have the largest impact on demand reduction. It starts at simulating default or new rate design based on historical energy consumption data. Additionally, energy providers can simulate load reduction via cloud-based power portfolio management and/or new behind the meter power supply such as solar or storage technology.
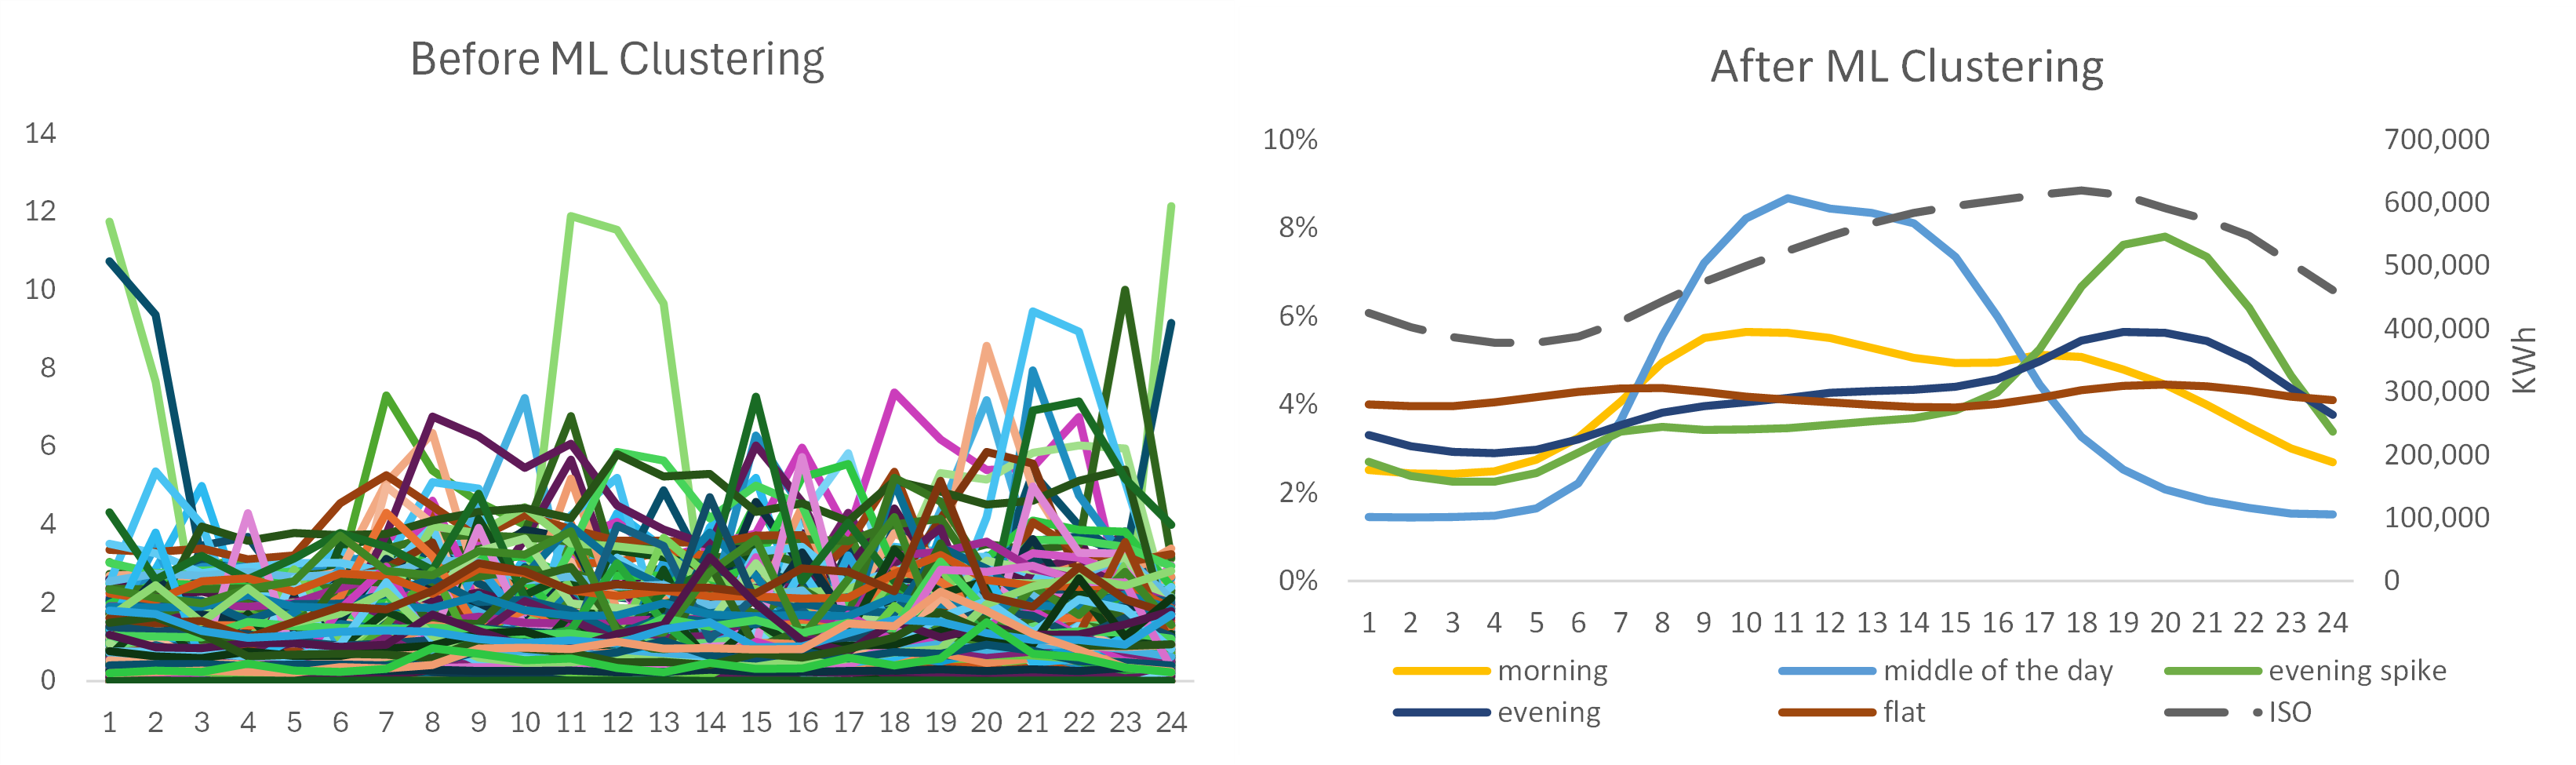
Machine learning clustering of load profiles at town level used for generating load visibility and evaluation of different shape loading strategies i.e. time varying rates or behind the meter tech such as solar and storage
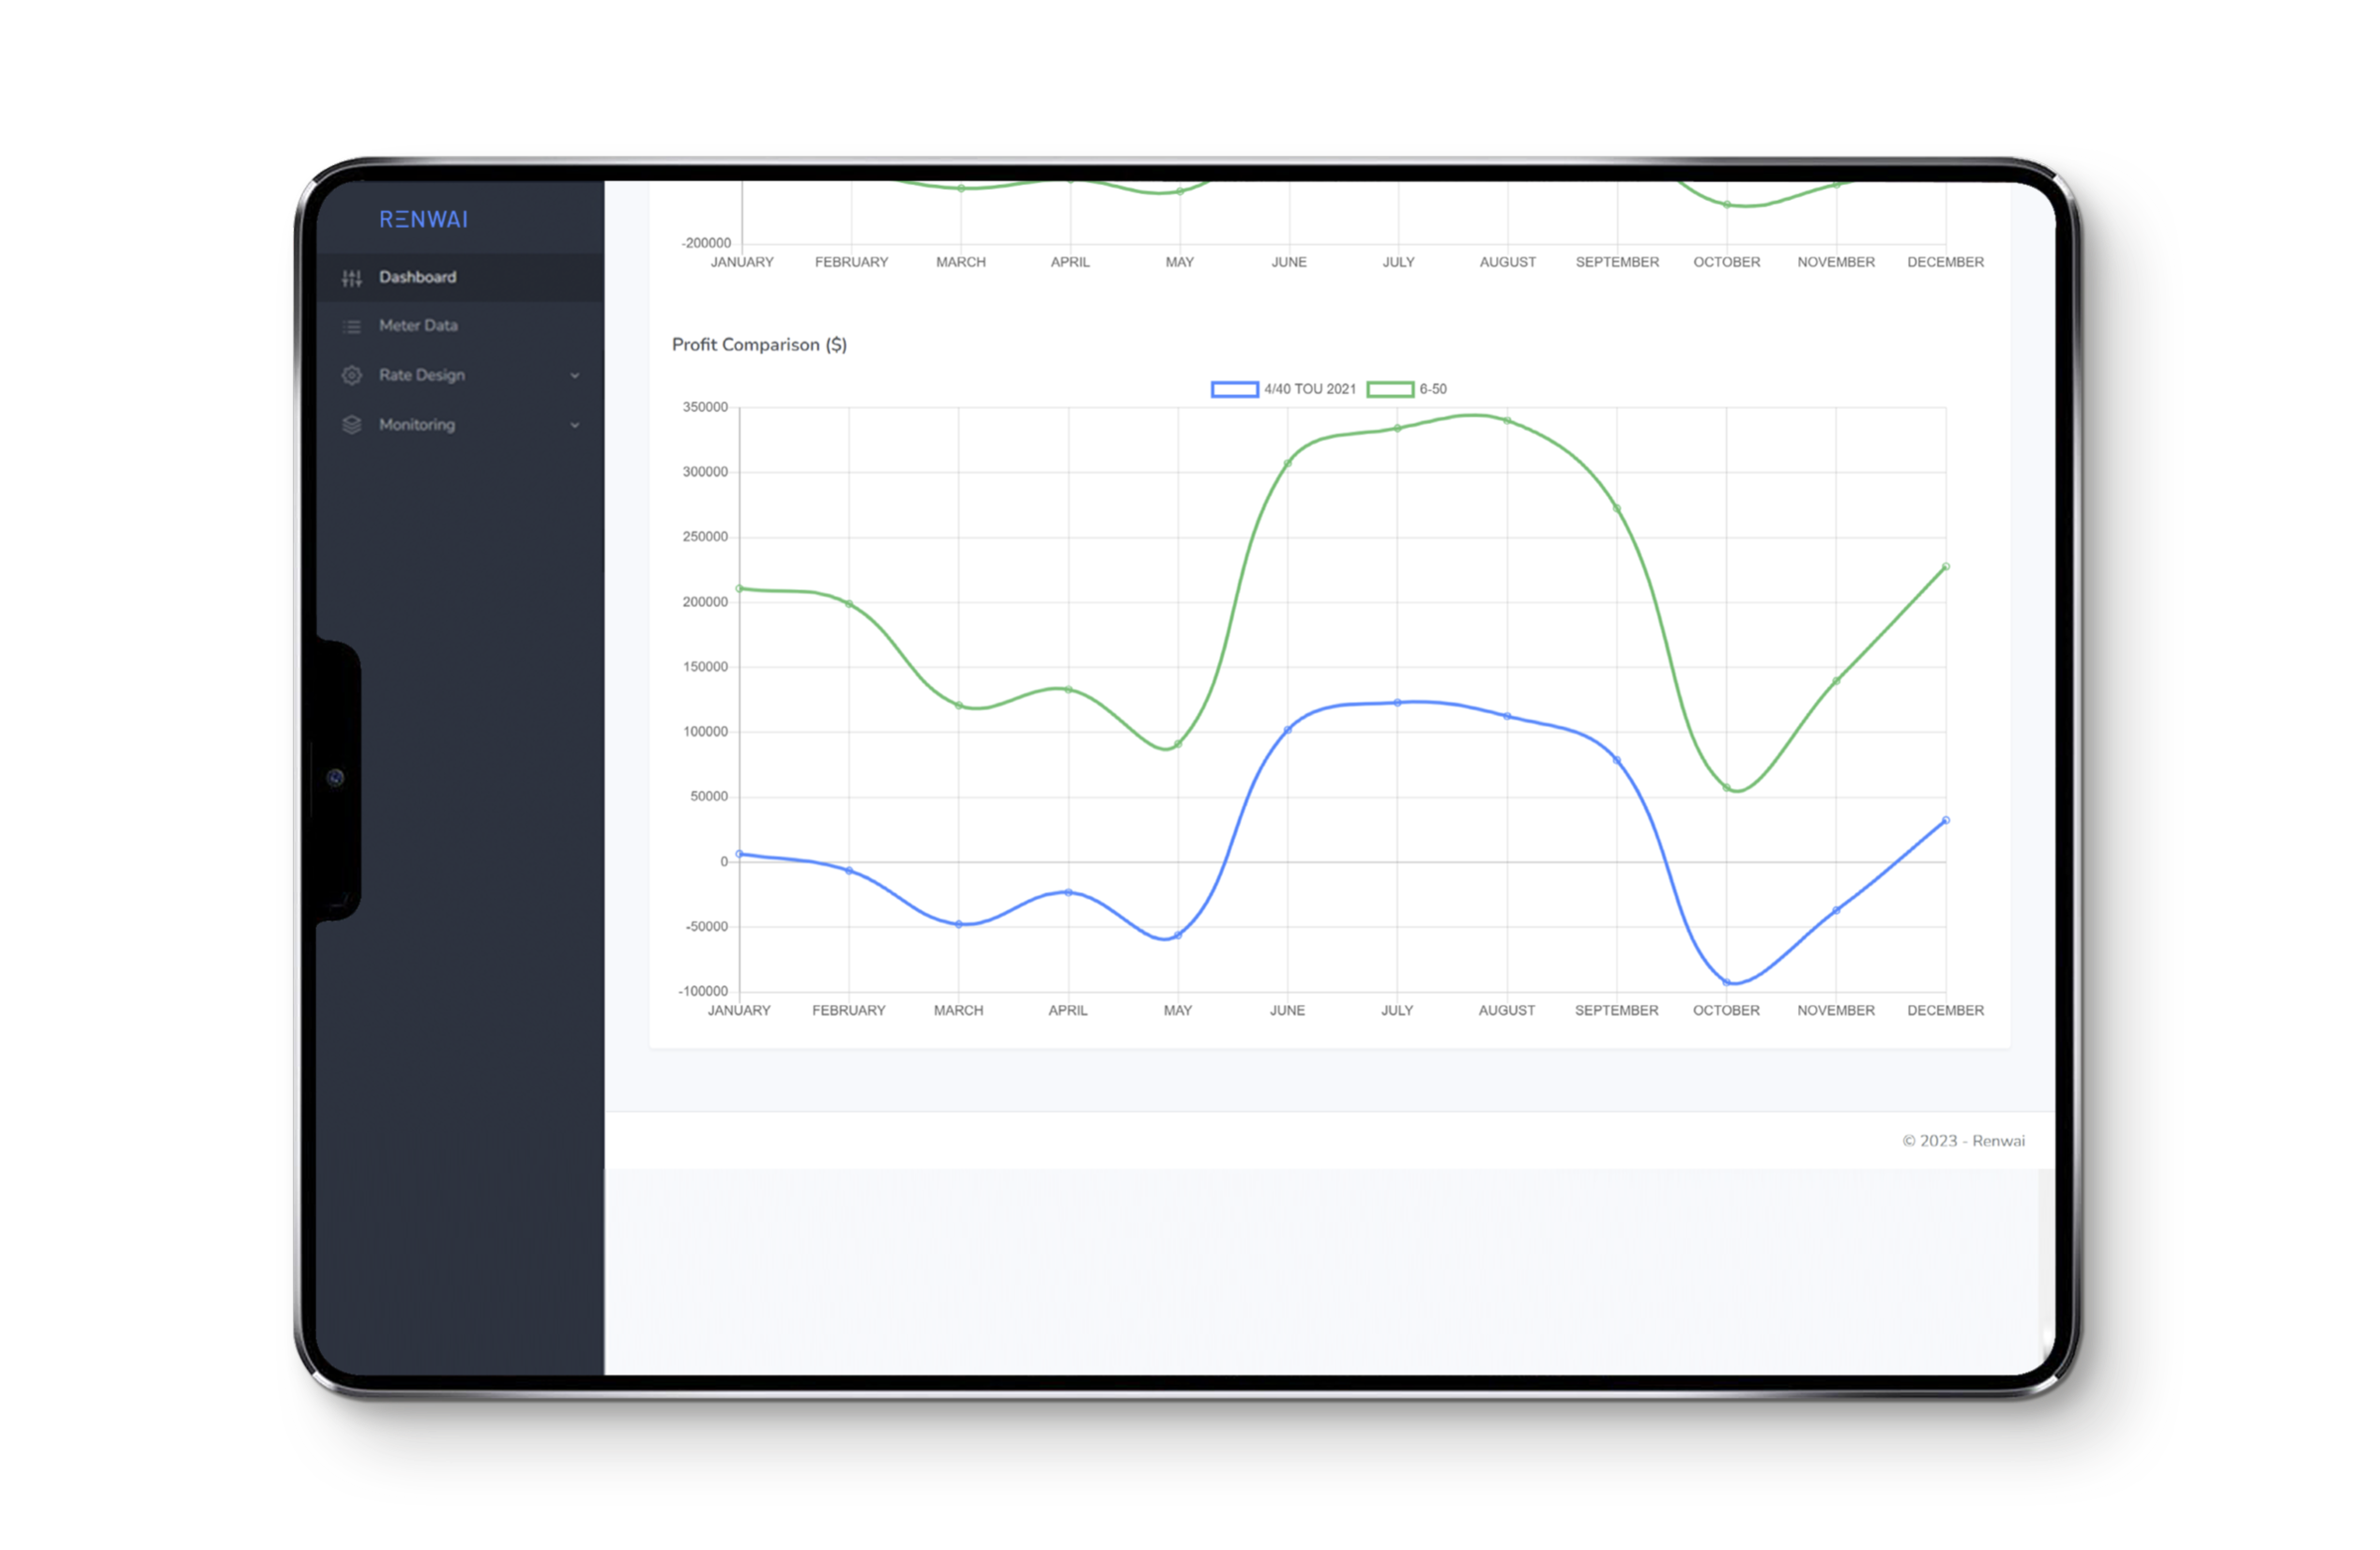
Savings ($) per Incremental 0.5 MW Capacity
Distribution companies can simulate battery storage against capacity and transmission costs starting at the meter level and within different rate structures
03
Implementation
Distribution companies can launch agile pilots to understand the impact on revenues, costs and customers bills of default or new rate structures.
As part of the premium features, distribution companies can run machine learning simulations for PPAs/forwards or energy storage procurement to better align load to default or new rates. The load visibility (diagnostics) and simulation data is continuously trained to to achieve conclusive implementation decisions.